A look inside.
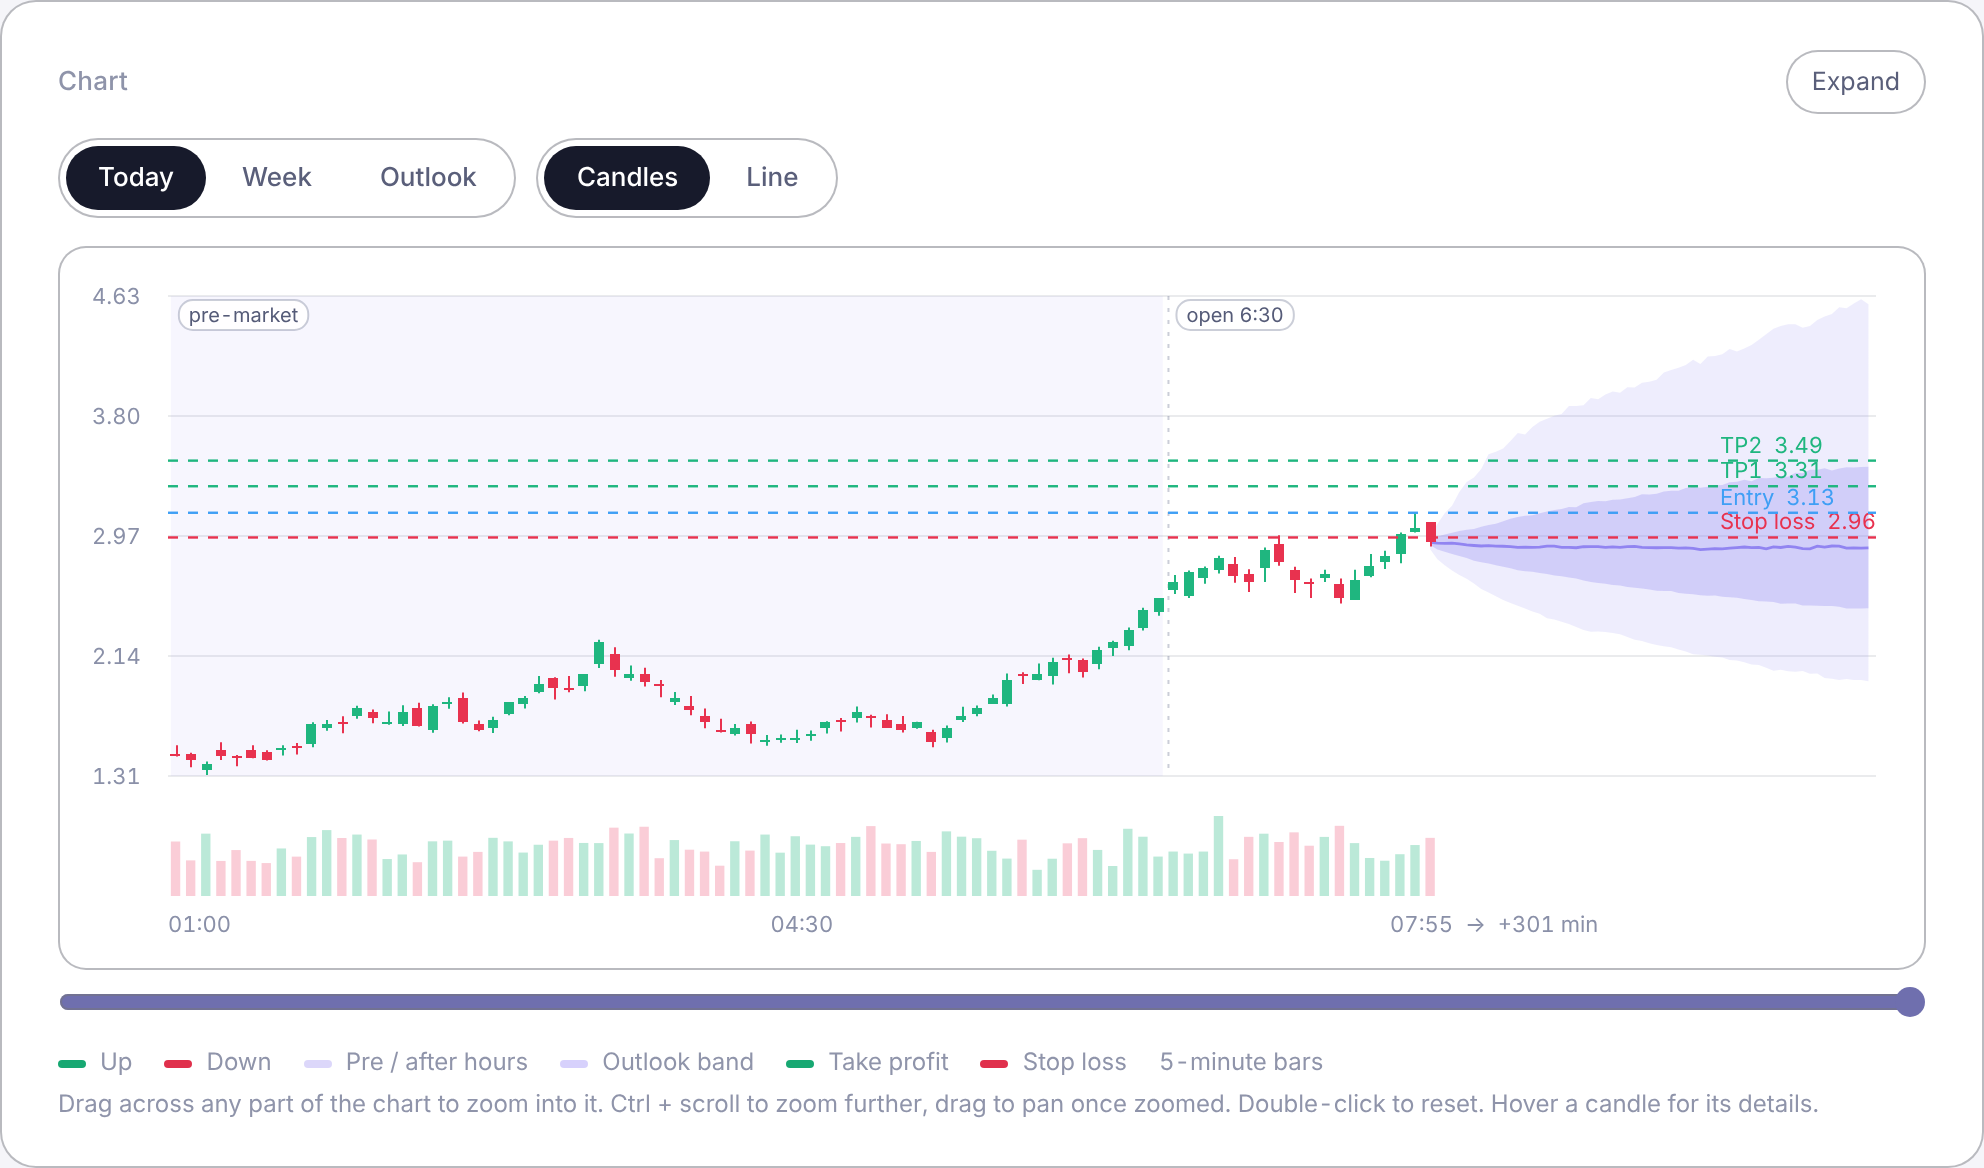
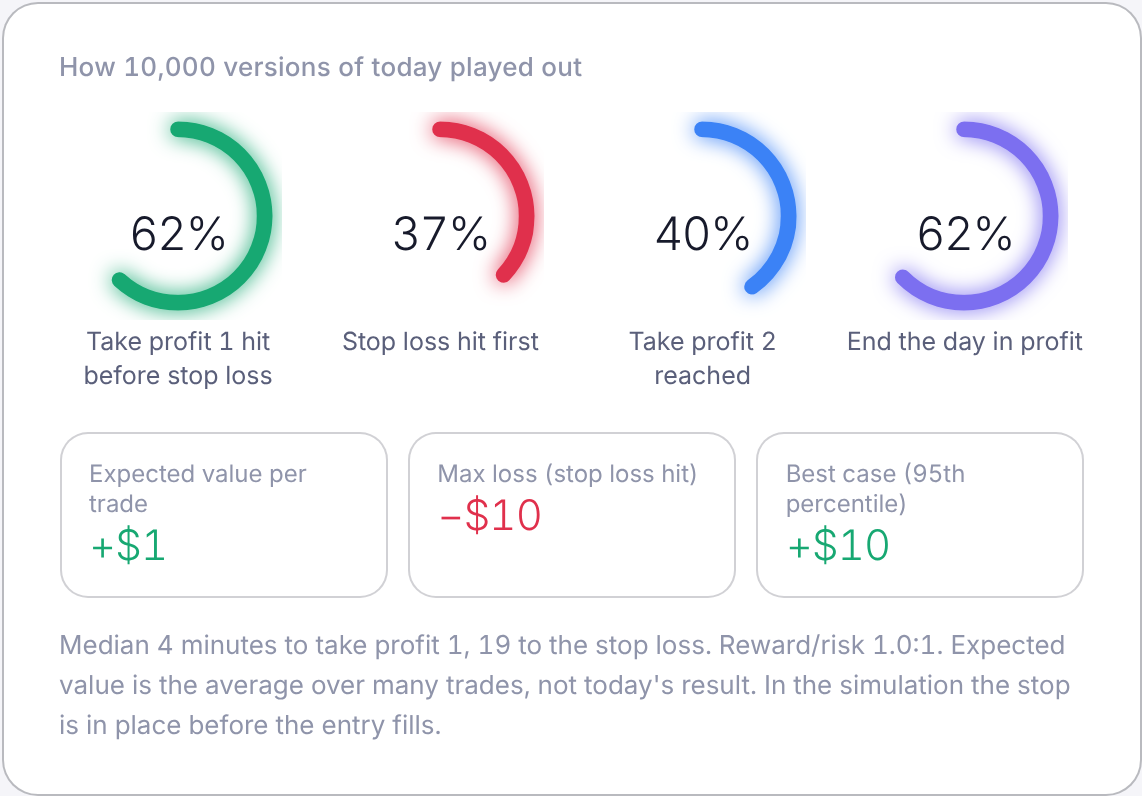
Real screens from the simulator. Pre-market shaded, the plan's levels drawn on the chart, and the band of where 10,000 versions of the rest of today went.
A real-time day-trading simulator for small, mid and large caps. Type a ticker. See where to enter, where to get out, and how often that plan actually works.
Card required, nothing charged for 14 days, cancel in one click. $29 a month after, or $249 a year.
The simulator rebuilds the rest of the trading day ten thousand times from how this stock itself has been moving, halts and gaps included, then shows you the plan that survives most of them.
A week of 1-minute prices including pre-market and after-hours, today's halts, the float, SEC filings and the latest headlines. Pulled fresh every time you ask.
Every version is built from the stock's own recent behaviour. Dozens of entry, stop and target combinations are tested against all of them.
Entry, stop loss, two take-profit levels and position size for your account, with the chance of each outcome printed beside it. If nothing has an edge, it says so.
Real screens from the simulator. Pre-market shaded, the plan's levels drawn on the chart, and the band of where 10,000 versions of the rest of today went.
Three real setups. Drag the slider to the chance you think each plan ends the day in profit, then see what 10,000 simulated versions of that day said.
What the simulator says about the three biggest movers right now. Refreshed every 15 minutes while the market is open, no sign-in needed.
Small caps where a halt or a share sale can take the whole move back in minutes. Mid and large caps where the question is whether your account should be in the trade at all. One simulator for both.
Entry trigger, stop loss, take profit 1 and 2, position size from your own risk rules. Type any amount and see exactly what you lose if the stop hits and what you make if the first target hits.
Halts are detected on the chart and included in the odds. Active share-sale filings, reverse splits and pump profiles force a Stay away verdict, however good the chart looks.
Freeze any moment in the last week. See the exact plan the simulator would have shown then, and what happened next. Check it before you trust it.
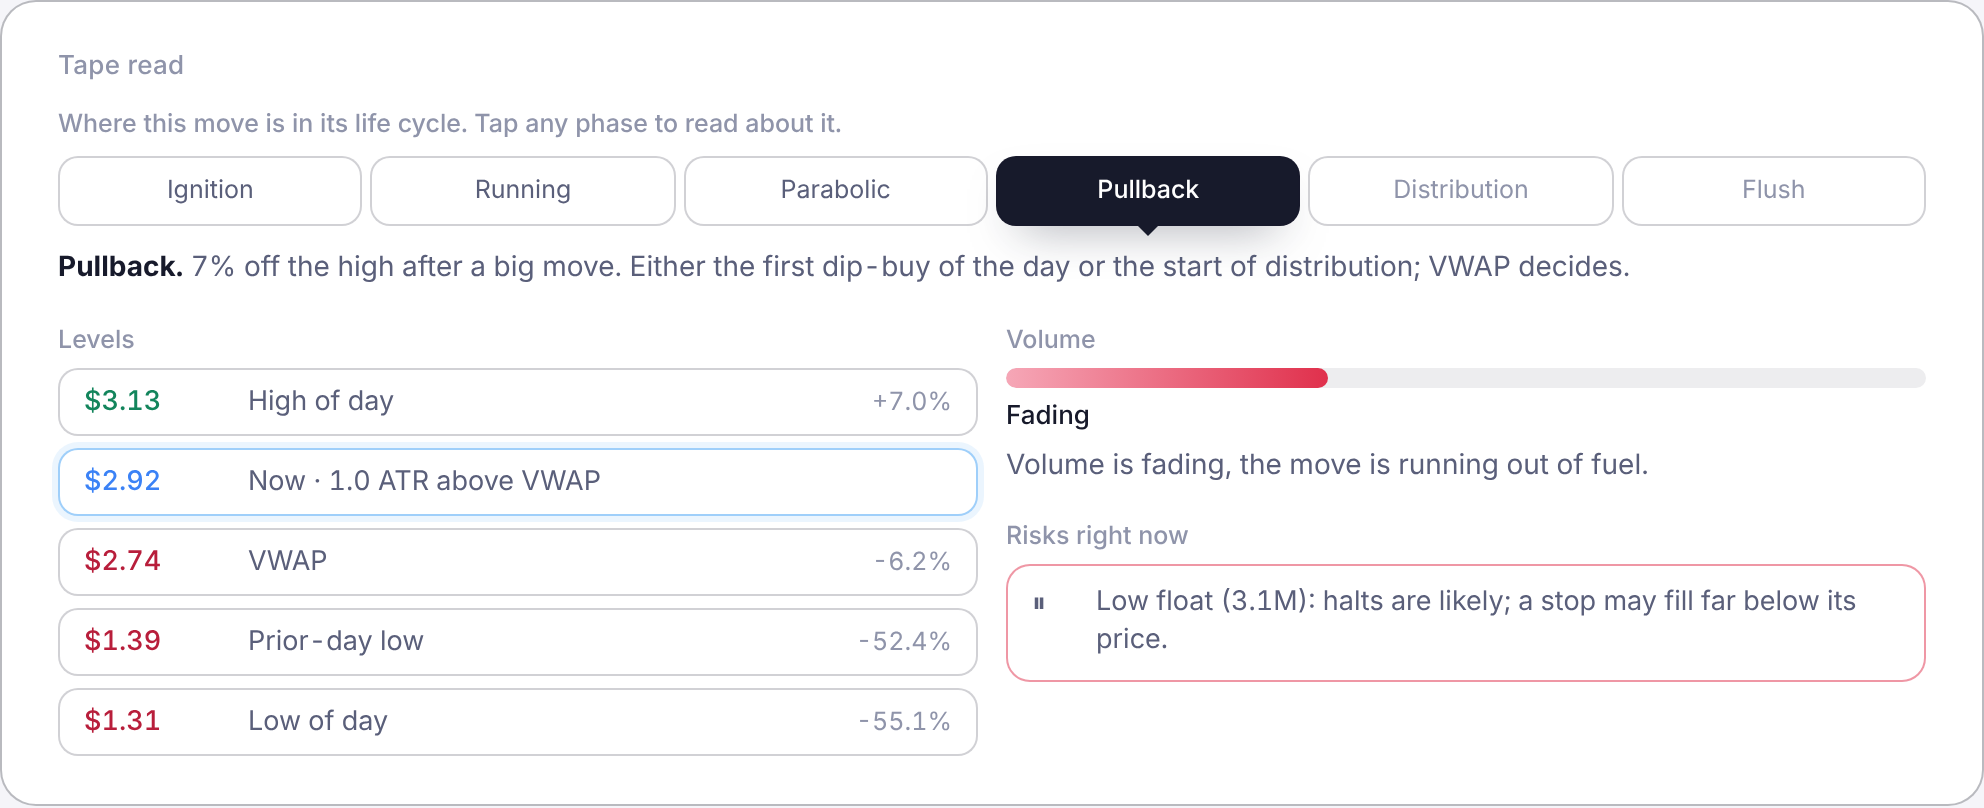
Smooth candles or line, pre-market and after-hours marked, halt markers, drag to zoom. The tape read shows which phase of the run the stock is in. News and SEC filings on their own tab, each filing one tap from the original document.
Open it in the browser, add it to your home screen, and it runs full screen with live updates while the market is open. One account, every device, nothing to install.
What is running now in small, mid and large caps, one tap from an analysis. Interactive lessons, a Questions section that explains every number on screen, and a plain-language glossary.
Each plan the simulator shows is logged and marked at the close: profit, stop or flat. The hit rate is published every week, misses included. If the odds say 55% and the record says 40%, you will see it here before we do anything about it.
The first scorecard publishes here after the first full week live. Every week after that, misses included.
A 55% plan loses 45 times in 100, and the losing ones can come five in a row with the odds still right. The simulator is honest about that on every screen.
Try it for 14 days at no charge. If it has not changed how you look at a chart by then, cancel in one click and you pay nothing.
No. daysim is a simulator that runs a statistical model on public price data and shows you the result. It does not know you, your finances or your goals, and it does not recommend that you buy or sell anything. Every decision and every order is yours. Read the Risk Disclosure before you trade.
Prices come from a public market-data feed that is delayed about 15 minutes and sometimes thin in pre-market. Filings come straight from the SEC. A real-time feed is the first upgrade on the roadmap; yearly subscribers get it first when it ships.
Rewind. Pick any past moment in the last week, see the plan the simulator would have shown, and compare it with what happened. Do that twenty times on stocks you know. The simulator also prints the chance the stop hits first on every plan, which anything trying to flatter you would hide.
It runs in your phone's browser and can be added to the home screen in one tap (Share, then Add to Home Screen on iPhone; Install on Android). It then opens full screen with its own icon, like an app, with nothing to download from a store. Live updates run while the market is open.
Yes. The News tab lists the latest headlines for the stock, flags the ones that mention an offering, warrants, a reverse split or a halt, and shows the company's SEC filings from the last 90 days with a link to each original document.
No. You sign in with your email and a six-digit code we send you, valid for ten minutes. There is no password to forget. Keep your email account secure, because whoever controls it controls your daysim account.
Your card is charged for the plan you picked on day 15. You get a reminder email three days before. Cancel from Settings at any point in the trial and nothing is charged. Cancel later and you keep access until the end of the period you paid for.
Monthly plans can be cancelled any time and stop at the end of the period; we do not refund partial months. Yearly plans are refundable in full within 14 days of the first charge. The full Refund Policy is linked below.
Yes, and that is where it is most careful. Foreign filers often announce share sales as filings after the close. The simulator checks those filings on every run and flags them.